End-to-End Development • Data Visualization
HomeScope: Interact with a housing market visualization tool designed to offer valuable insights into demographics, property types, and housing market trends.
Capstone project completed under the guidance of Dmitriy Babichenko.
Background
As part of my senior capstone course, I collaborated with a team to design and develop HomeScope, a web application aimed at making housing market data accessible and understandable for diverse users. This project was not only a technical challenge but also an opportunity to apply academic learning in a real-world context, deepen my full-stack development skills, and practice teamwork and project management.
Defining the Problem and Designing a Solution
We began by reflecting on the struggles of moving, especially for first-time renters, homebuyers, or people relocating to unfamiliar areas. We summarized this challenge in our problem statement:
Finding a new place to live can be an overwhelming process, especially for individuals with unique needs, limited resources, and limited experience. Current tools often lack personalization, clarity, or inclusiveness for a diverse range of users.
This set the stage for developing our System Design Document, where we outlined our goals: a responsive web app, personalized search, map visualizations, and easy-to-understand data about demographics, housing, and crime.
We created personas like Josiah (a young professional moving for his first job), Claire (a first-time homebuyer), Salvatore (a real estate agent), and Carol (a policymaker) to ensure we designed with real users in mind.
My Role and Contributions
Once our problem and goals were clear, we moved into designing and building HomeScope, a platform that could make complex housing data approachable for all kinds of users. My role centered on translating our ideas into a working solution through full-stack development, visualization optimization, and deployment.
Frontend Development
I led the implementation of React components including the homepage, location-based insights, and renters’ insights pages. I focused on creating a clean, intuitive, and accessible user interface, applying UX/UI principles learned in coursework.
Backend and API Integration
Using Flask for the backend, I developed API endpoints that dynamically serve visualization data. I integrated these with the React frontend through Axios calls, bridging the two technologies and ensuring smooth communication.
Data Visualization Optimization
Our initial visualizations were static HTML exports from Jupyter Notebooks. I redesigned the system to dynamically load data on demand, significantly improving performance and user experience.
Deployment & DevOps
I managed deployment of the integrated React-Flask application to Render, overcoming challenges with routing, API endpoints, and build configuration.
Overcoming Challenges
Like any capstone, HomeScope came with challenges:
Data limitations: Without access to real-time APIs, we gathered and cleaned static data from public sources like Census datasets and Redfin. I helped structure this data to power our visualizations.
Technology integration: Merging a React frontend with Flask backend required careful coordination. I implemented the API calls and handled deployment challenges on Render.
Balancing simplicity with functionality: We wanted rich filters and data views without overwhelming users, so I contributed to designing and refining these interfaces to support that balance.
Final Outcome
Our final deployed product is a result of our technical, collaborative work, which you can explore via our final report and application below
Screenshots

Landing page
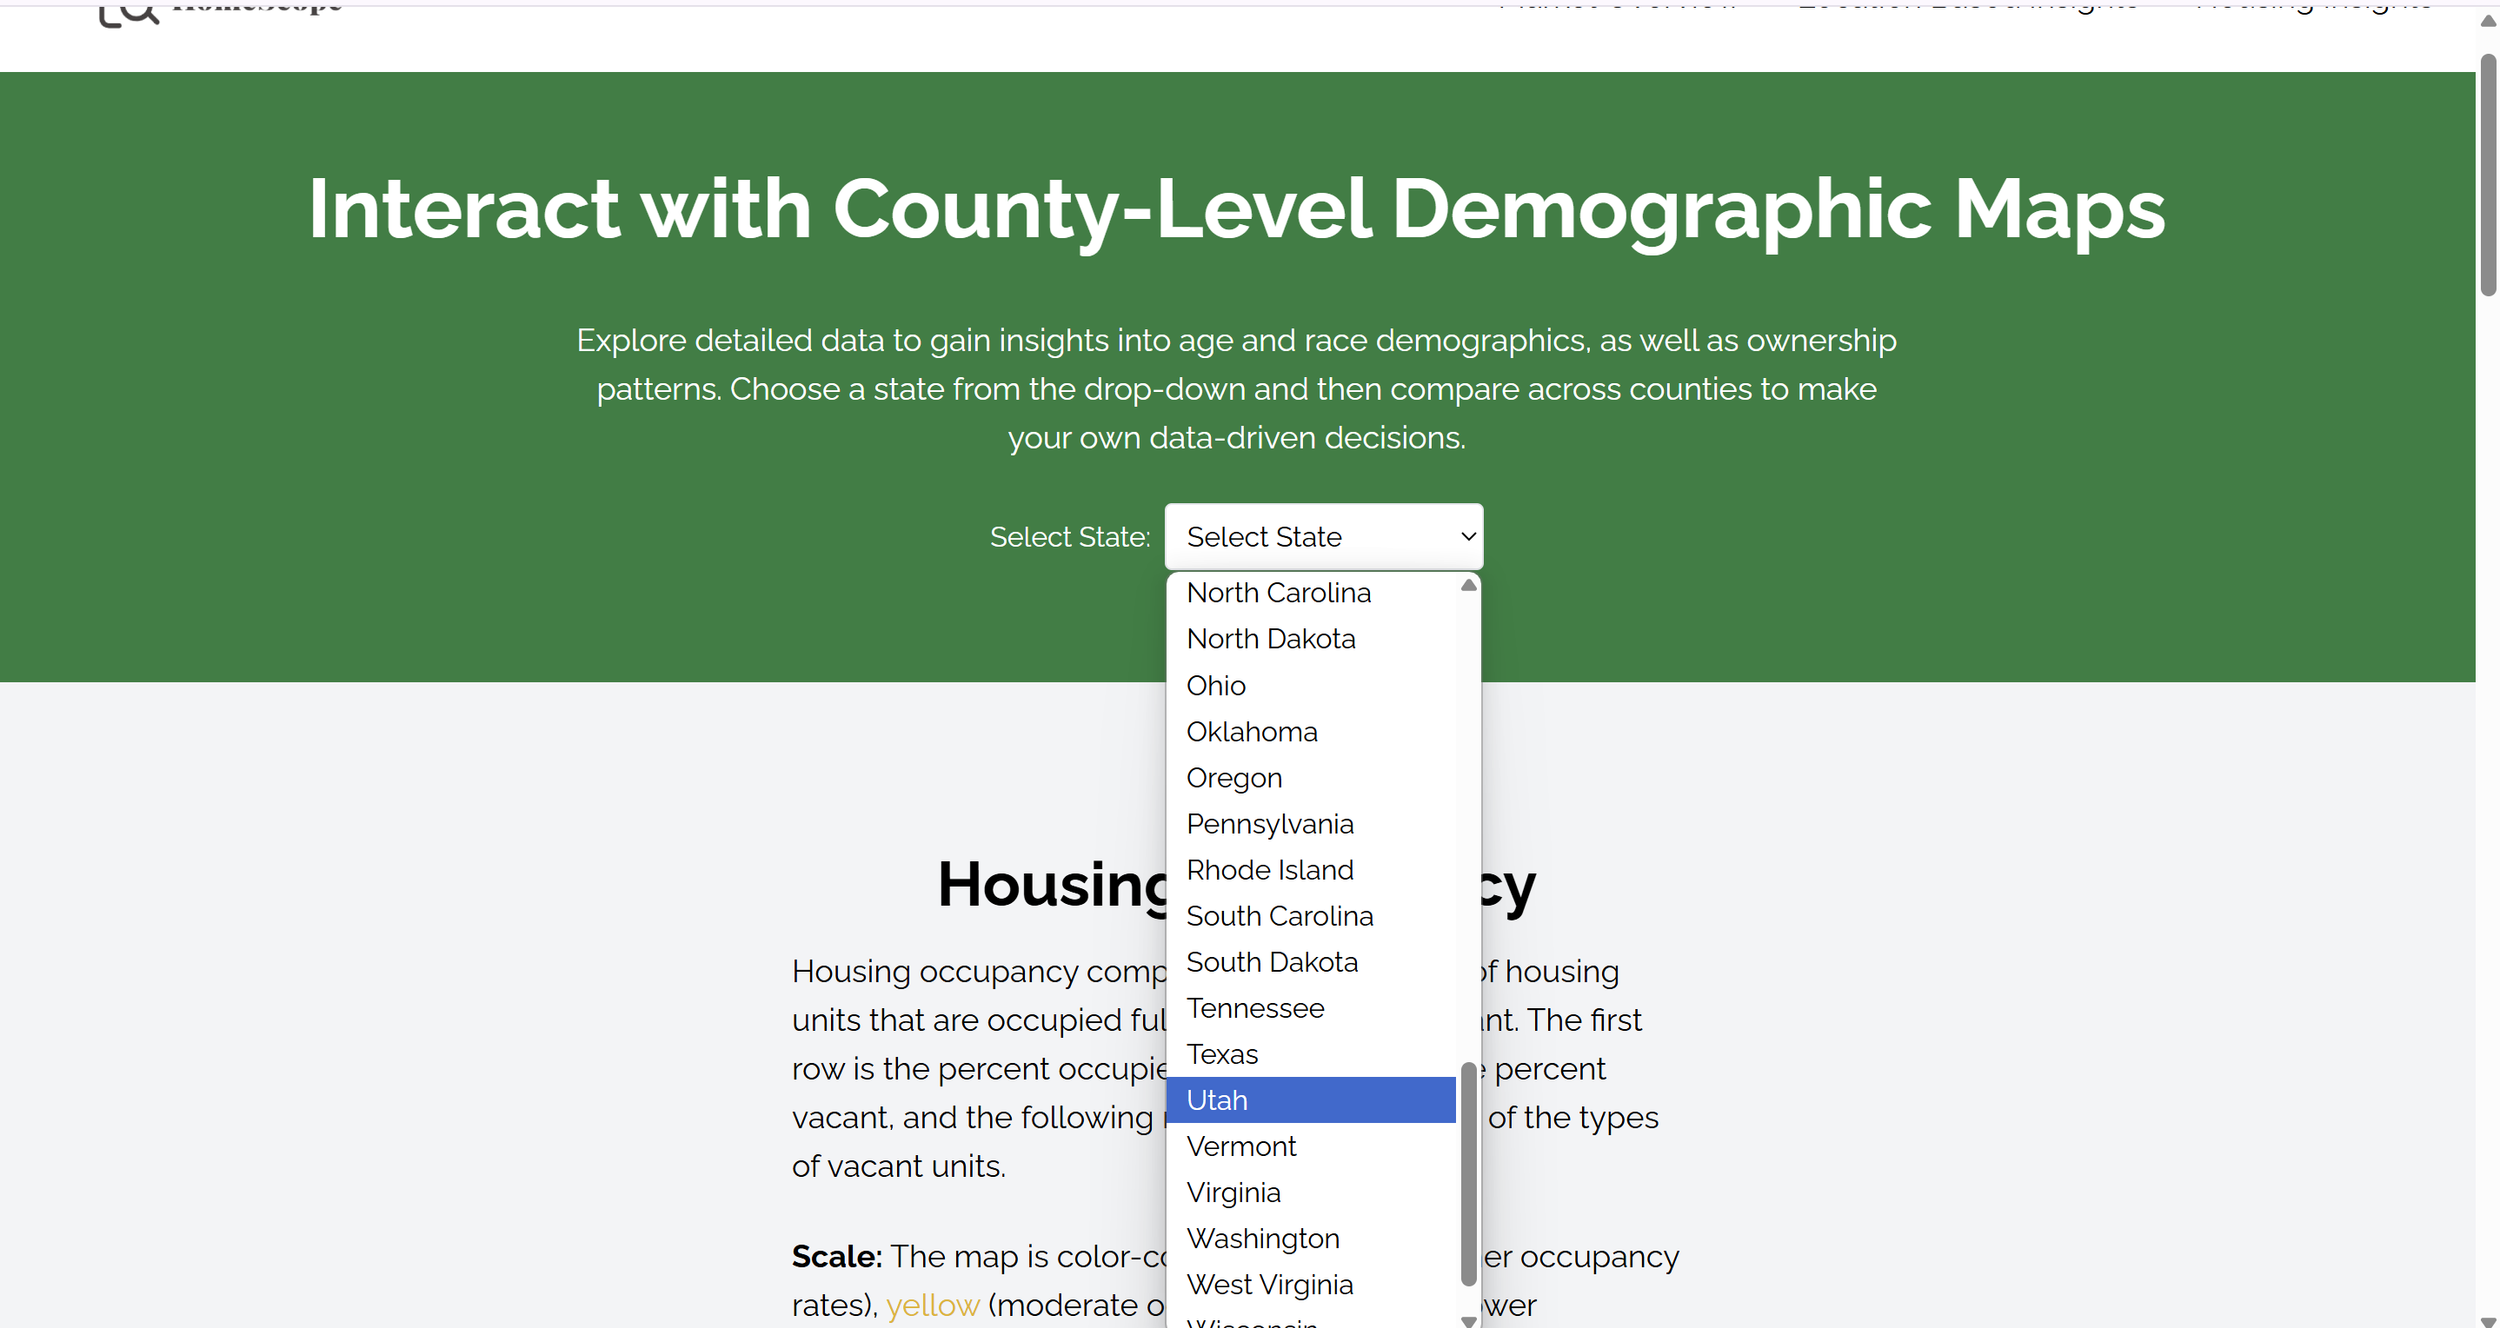
Pick a state to interact with
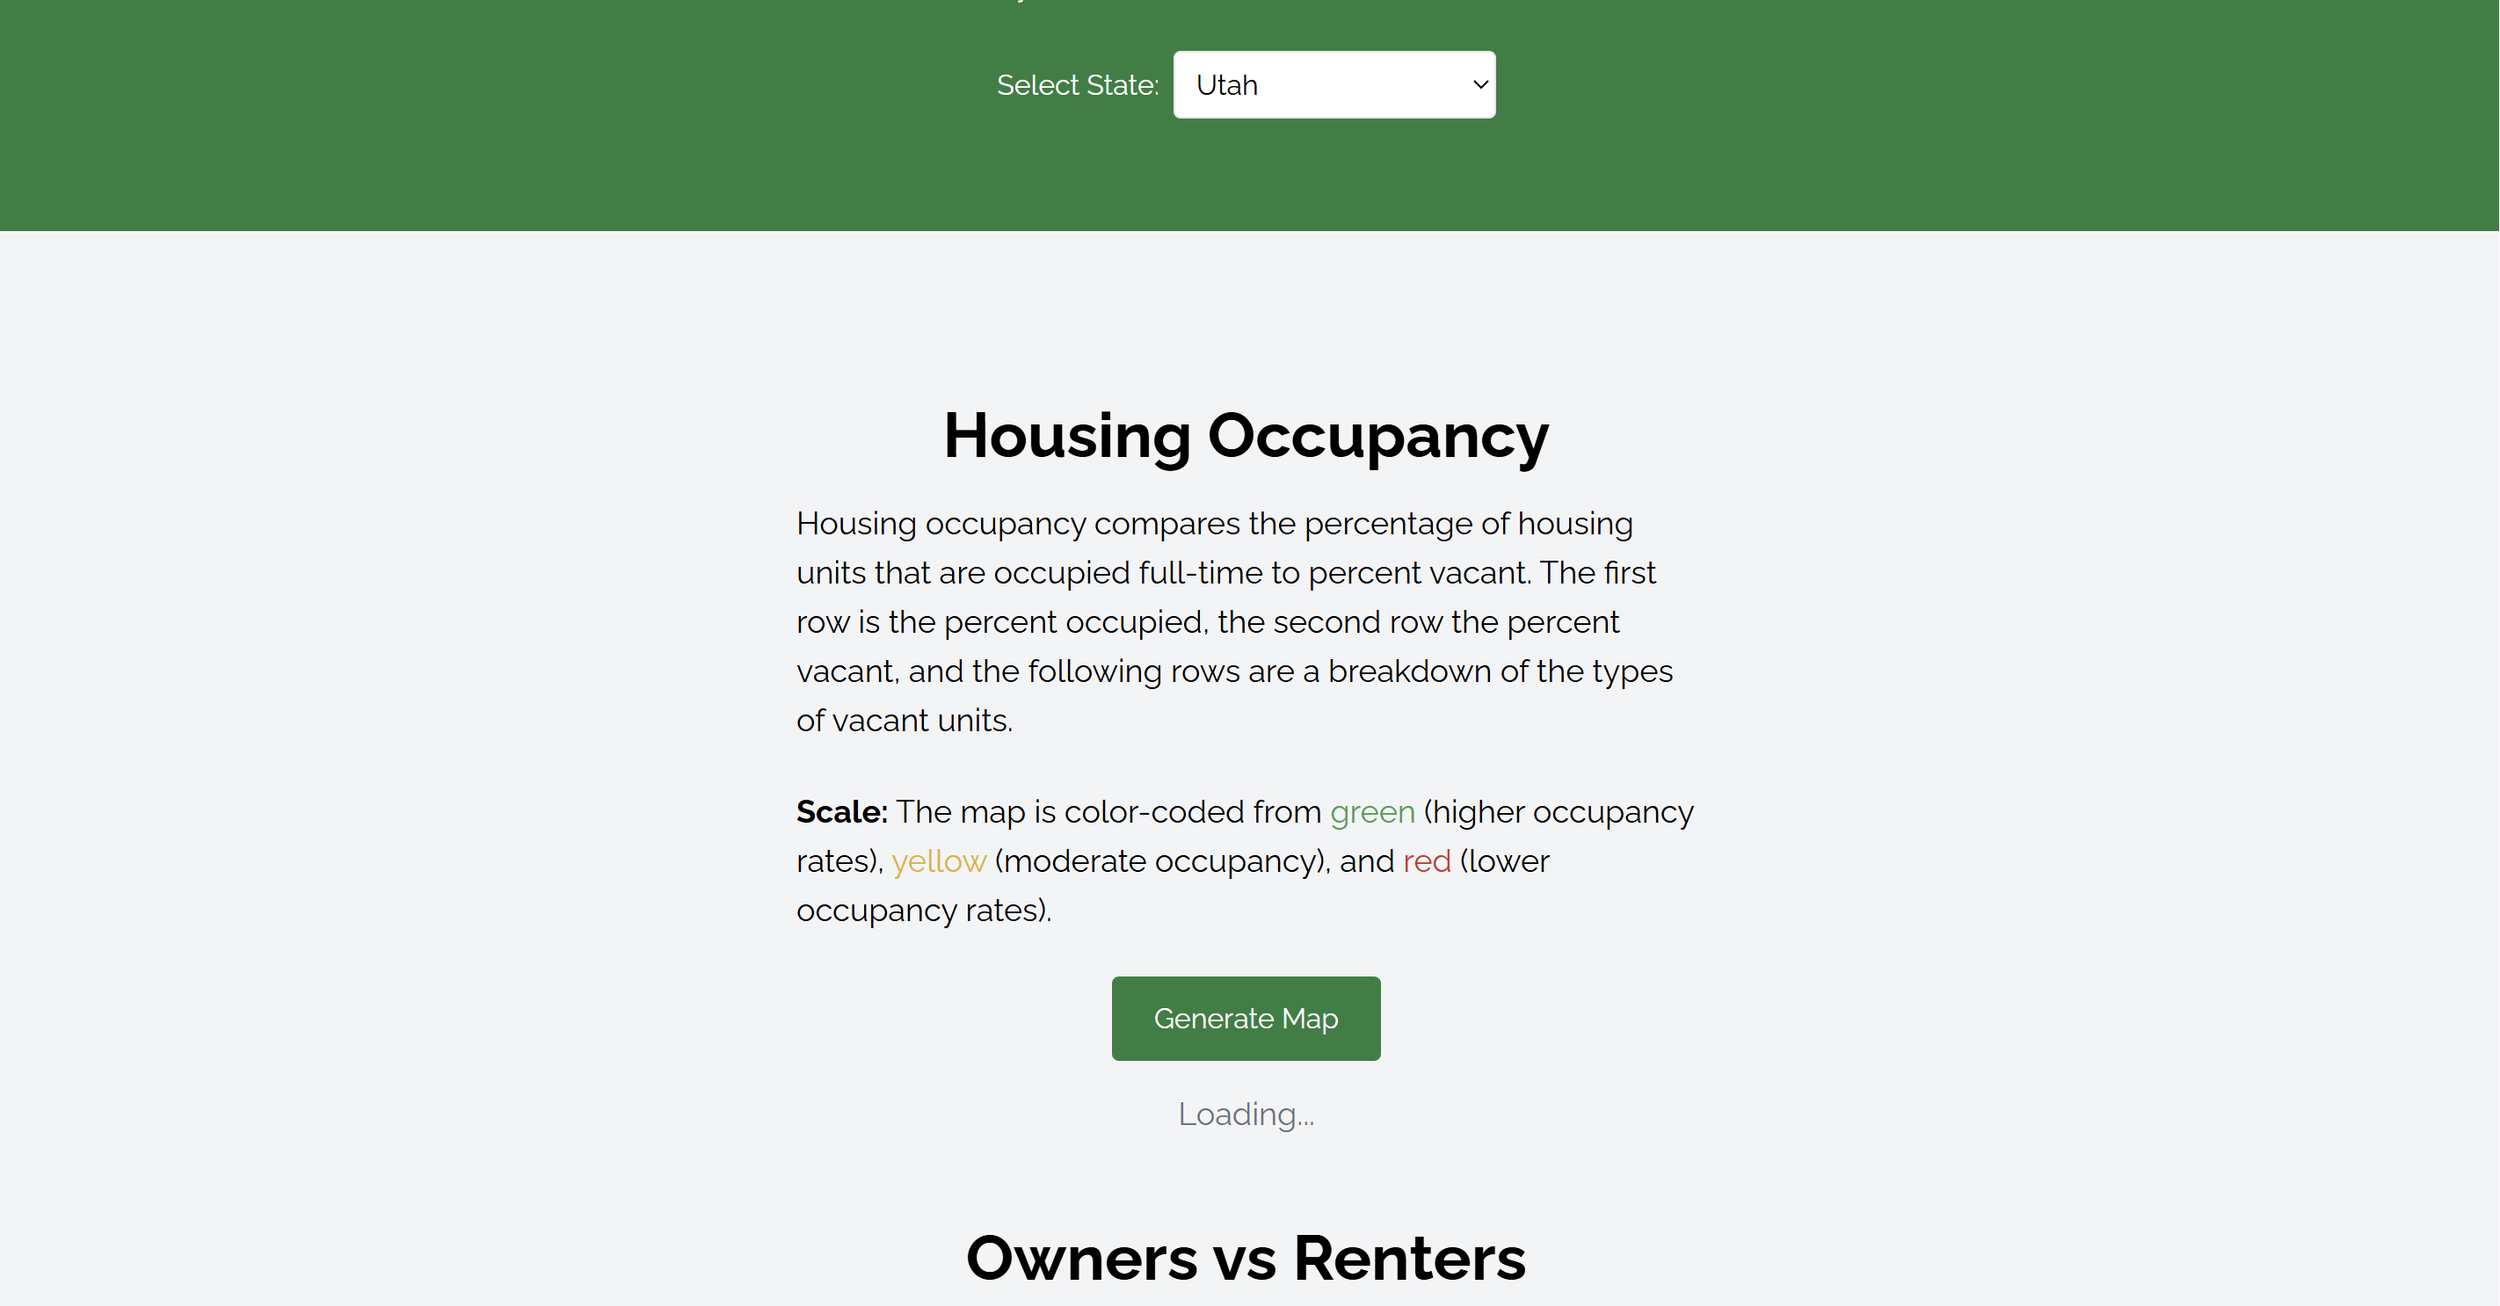
Generate a map
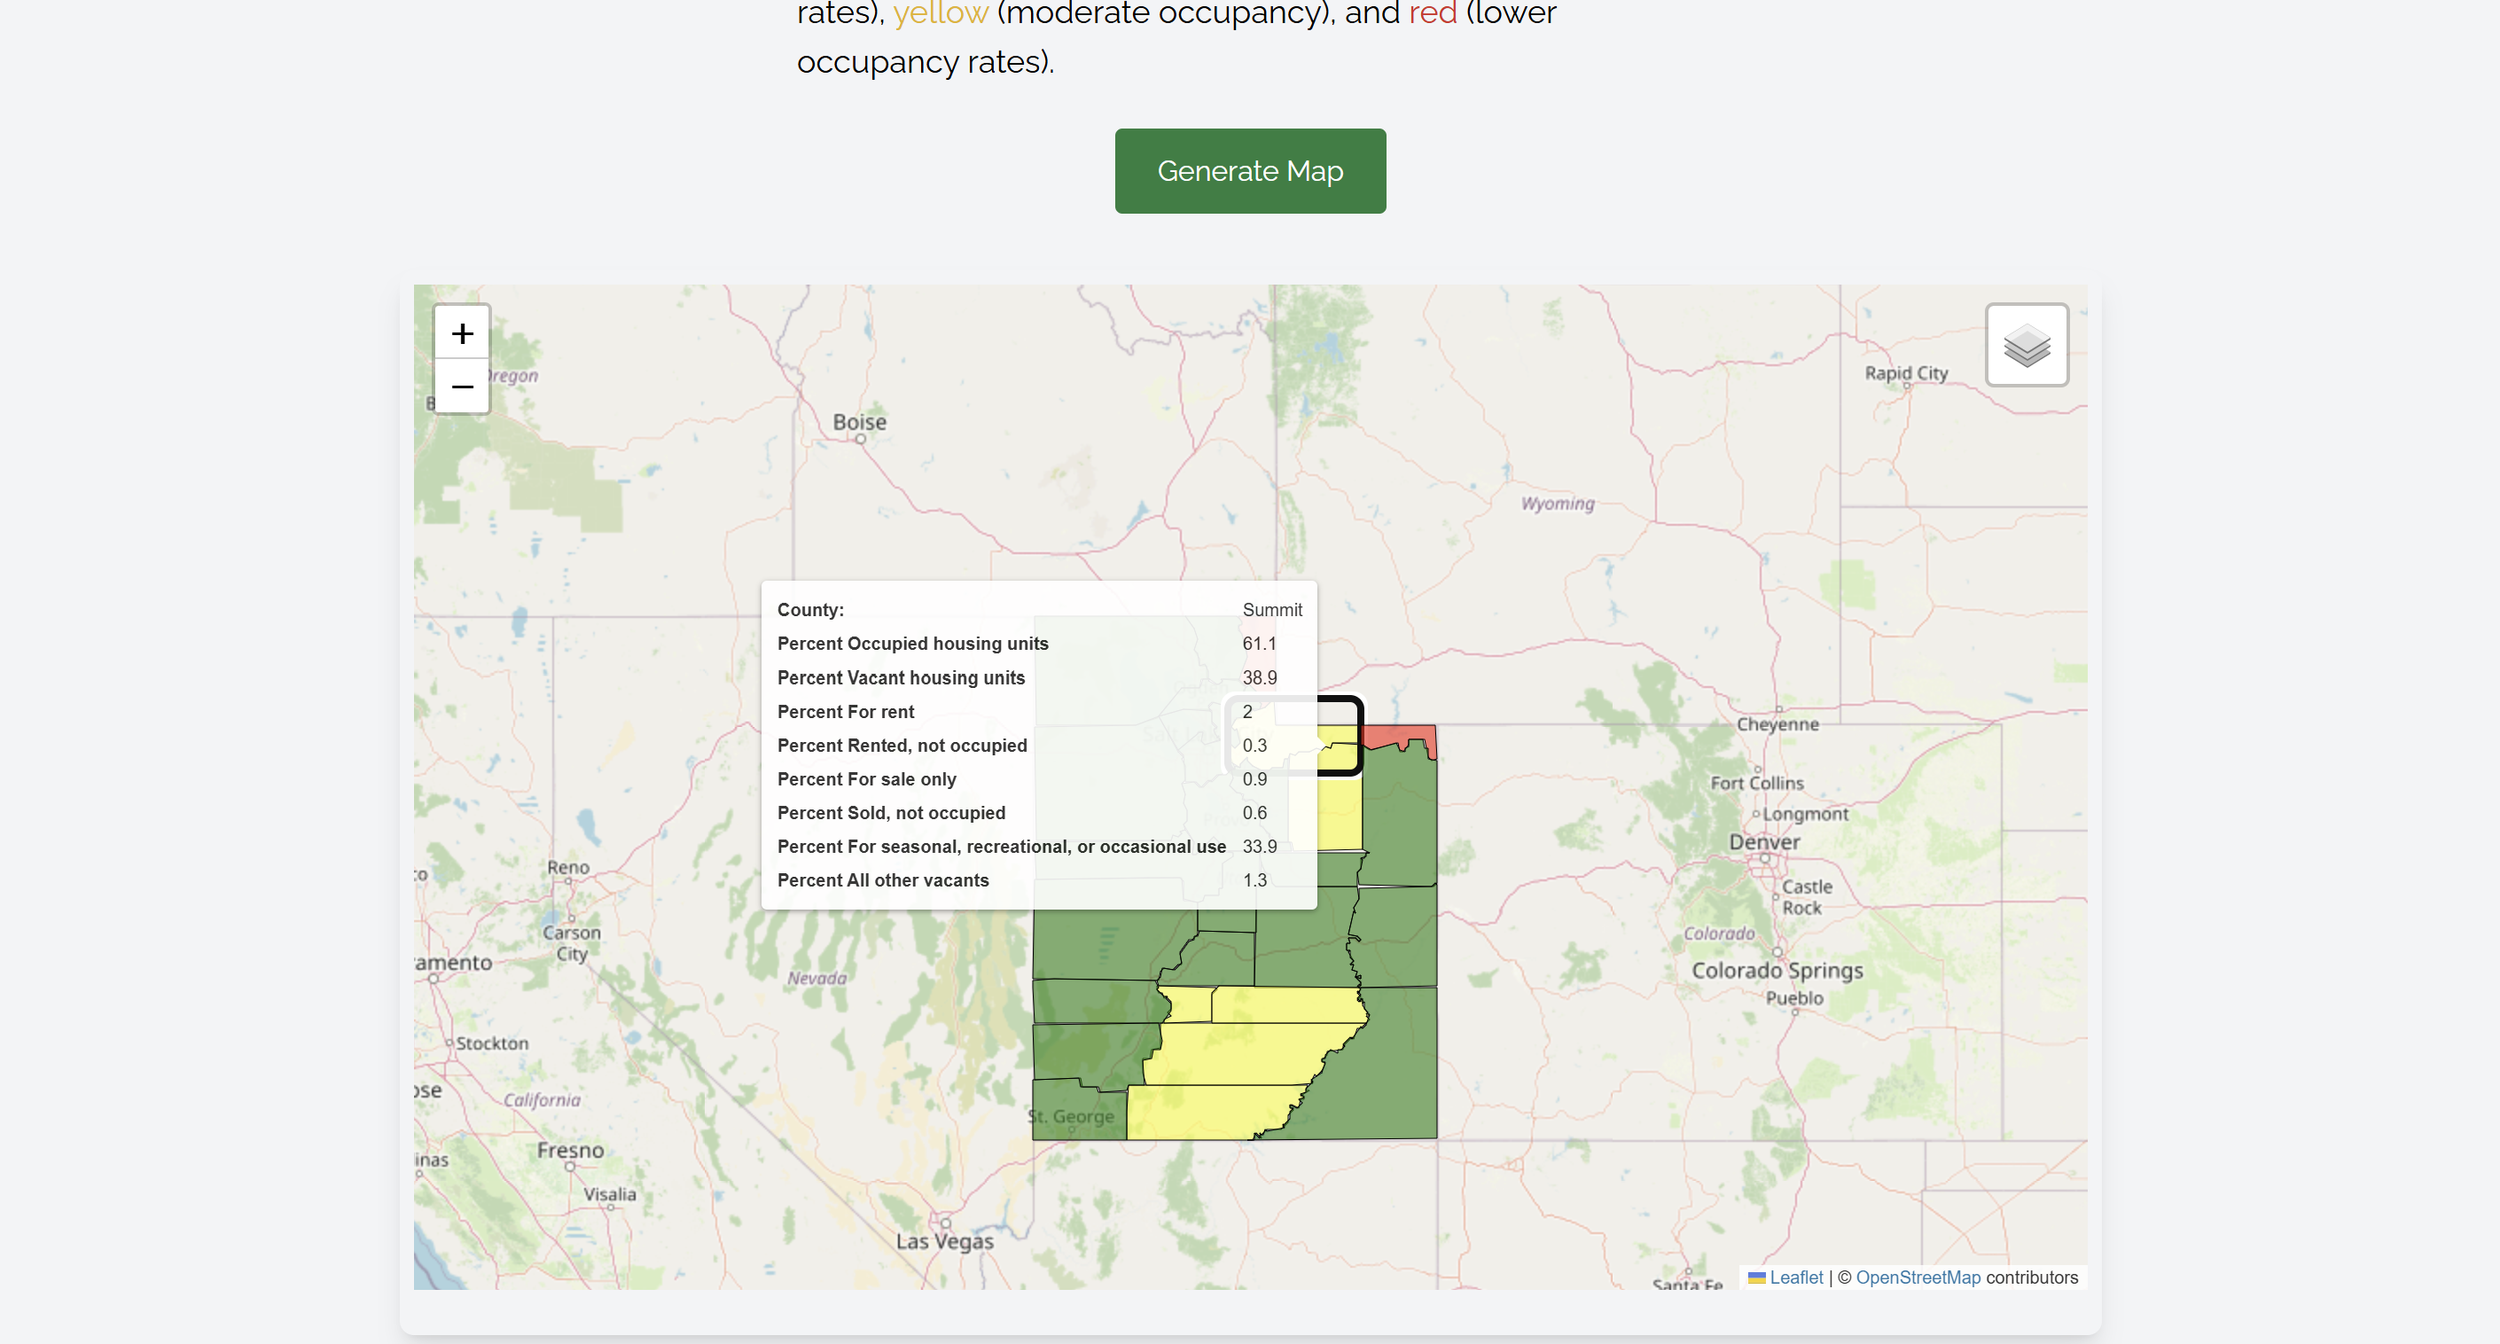
Navigate statistics across counties
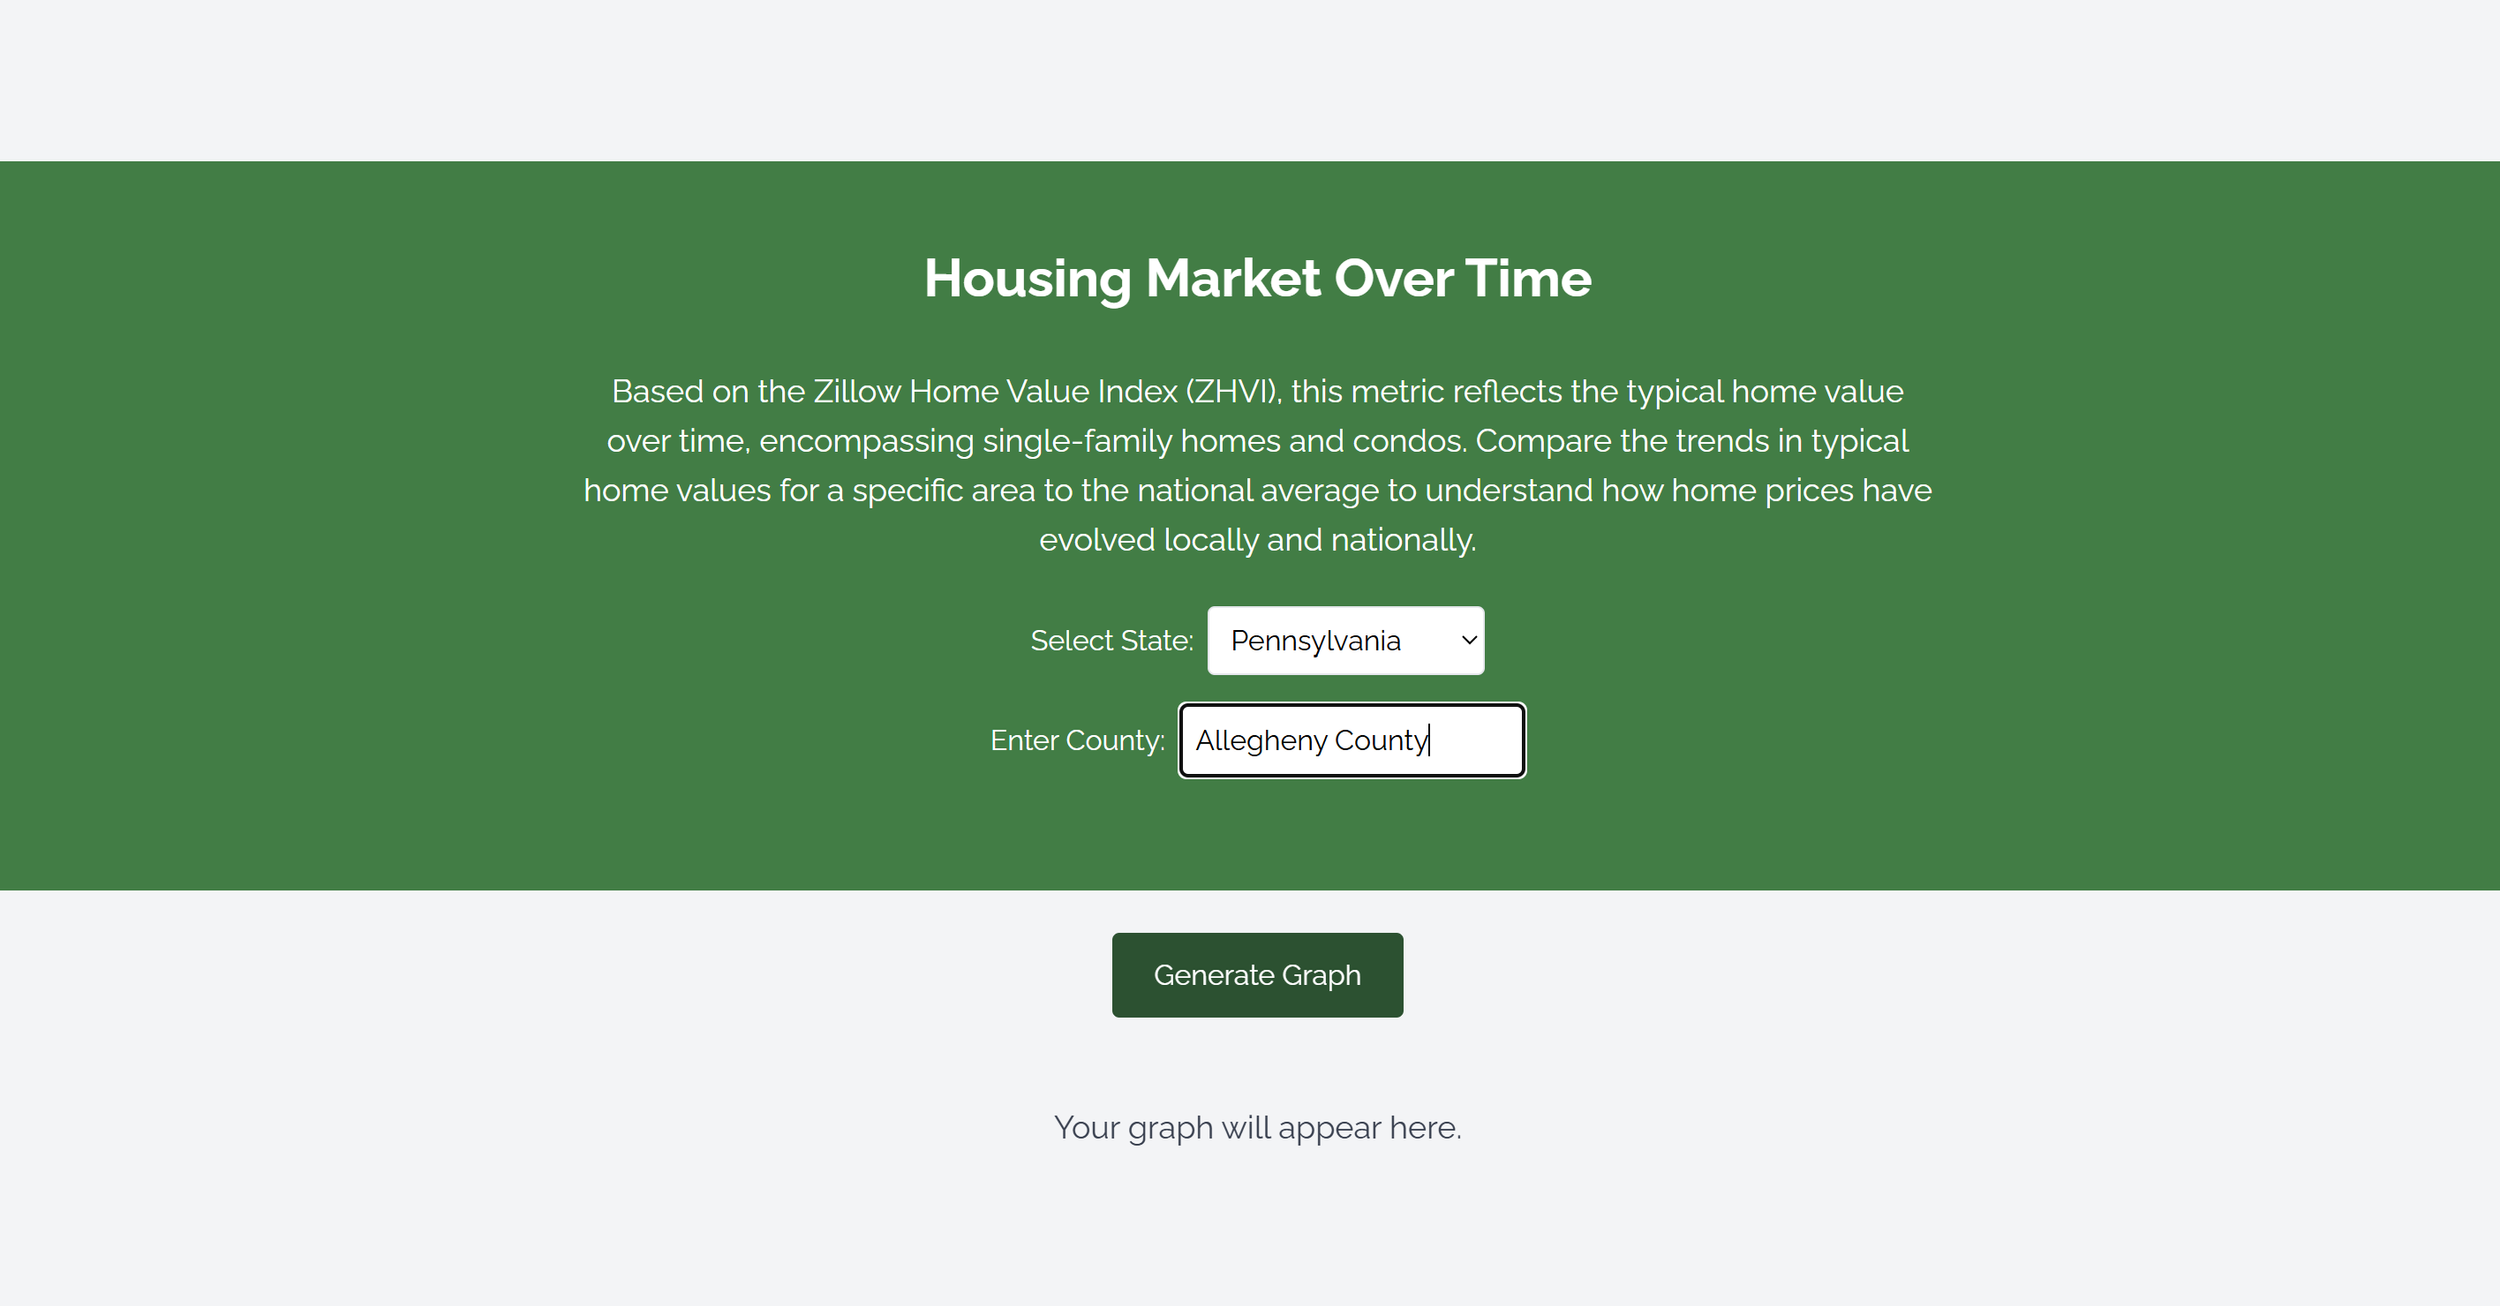
Generate line graphs
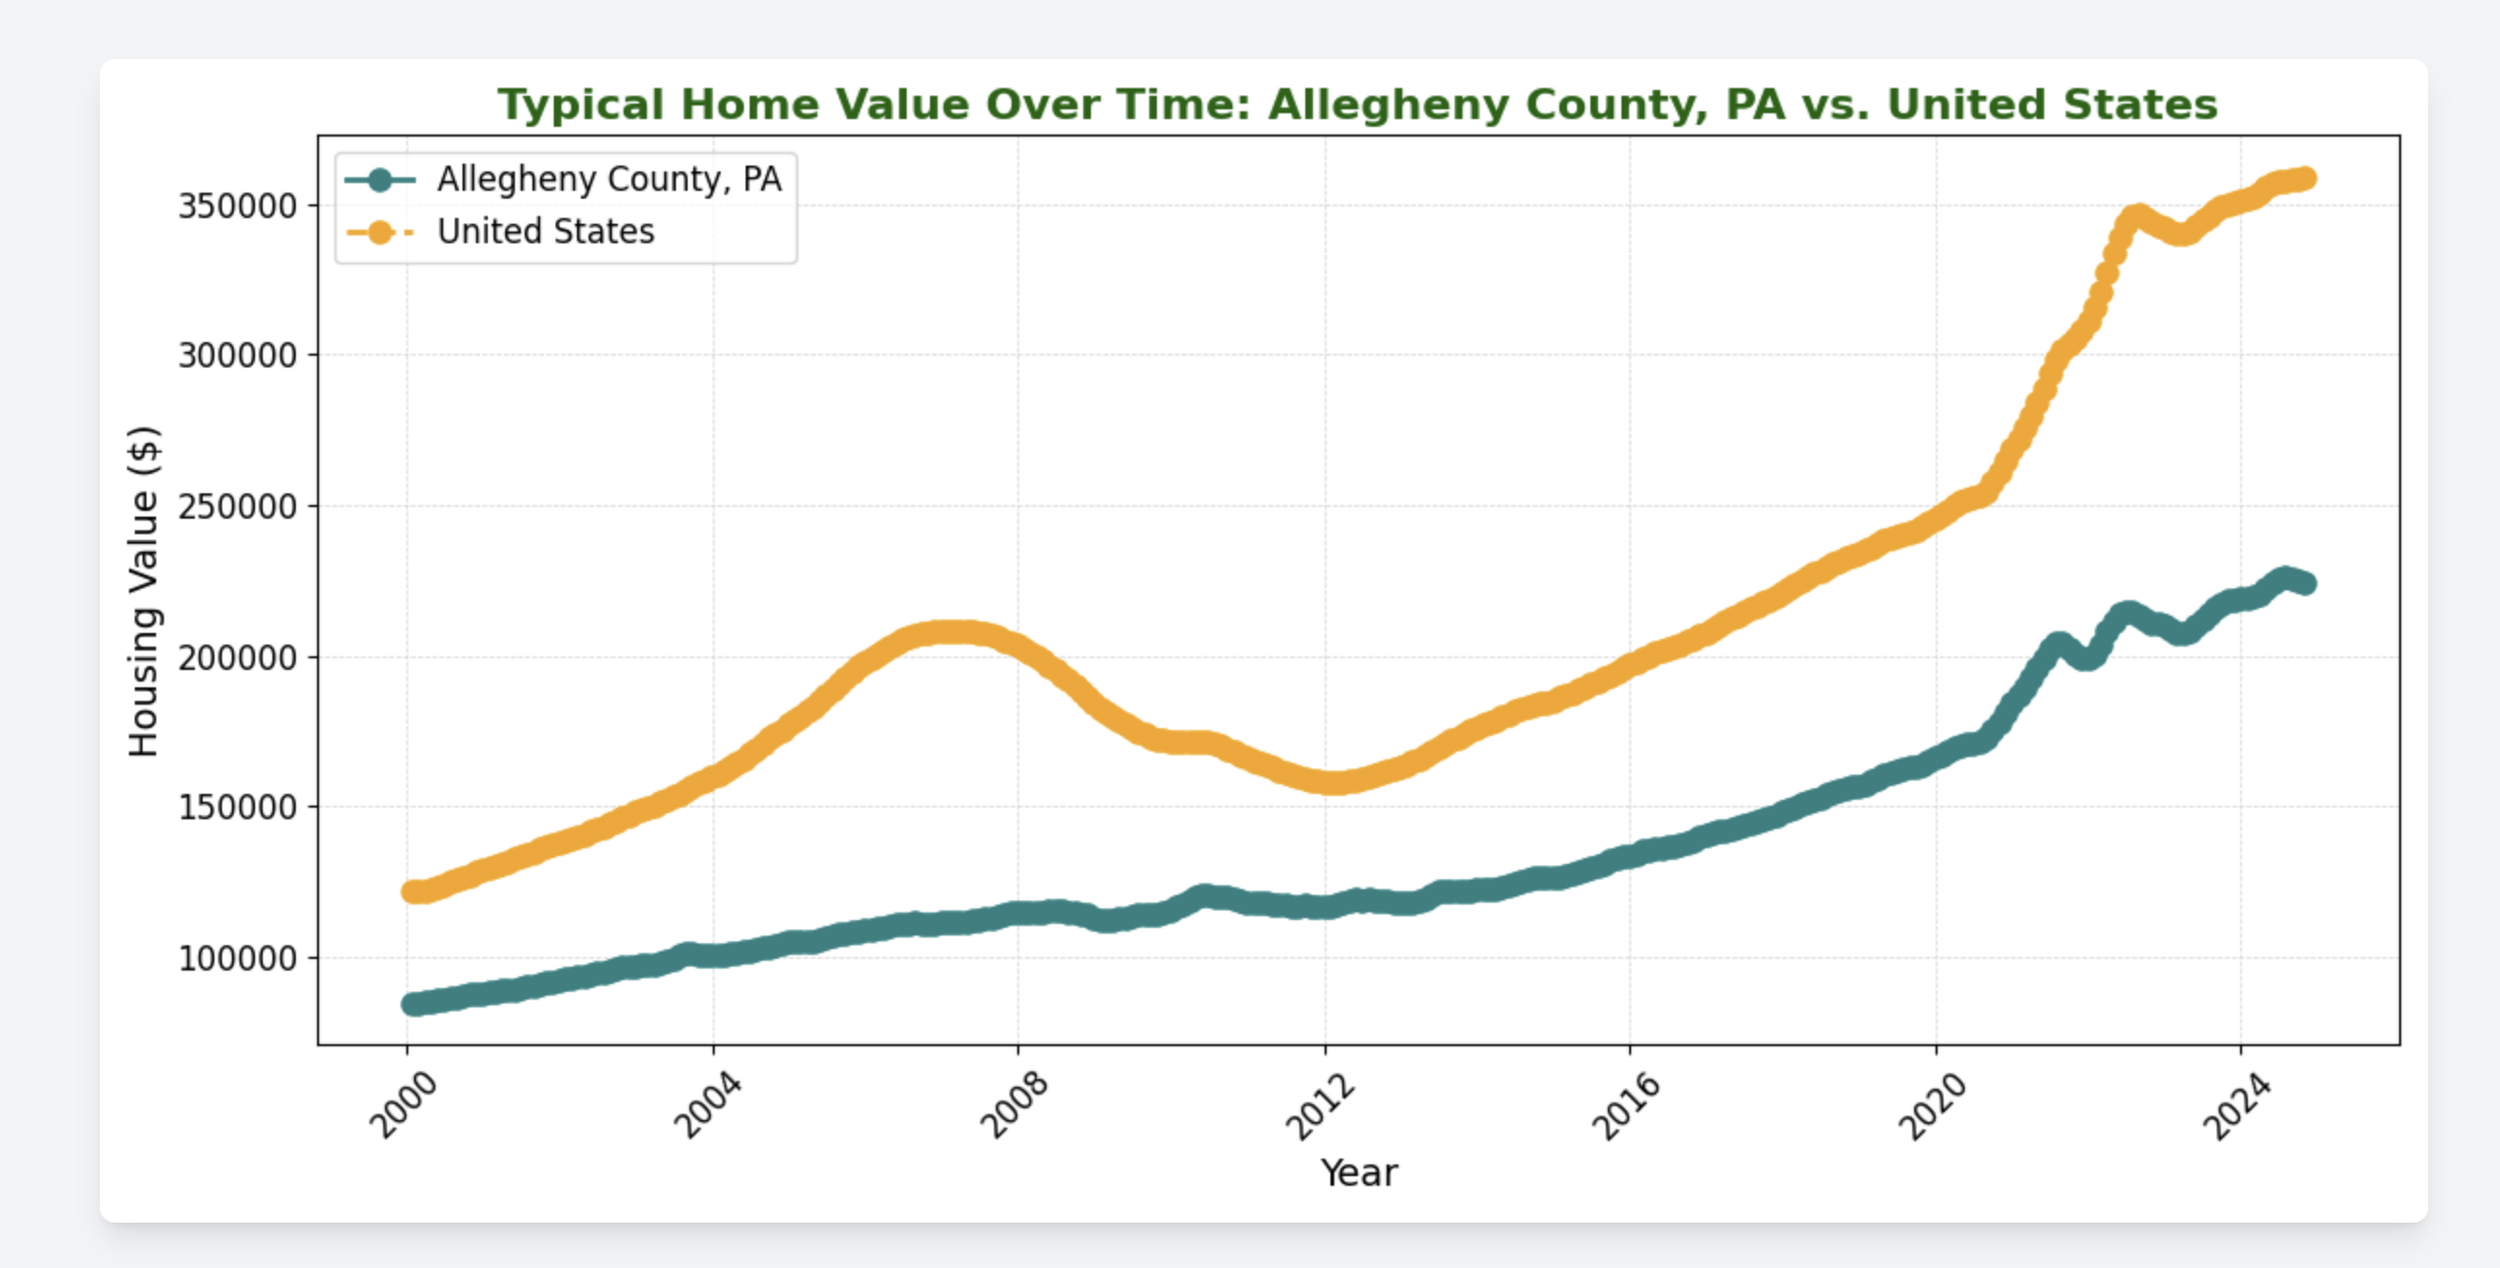
Explore typical home value over time compared to national average